

Hard Surfaces Absorb Heat
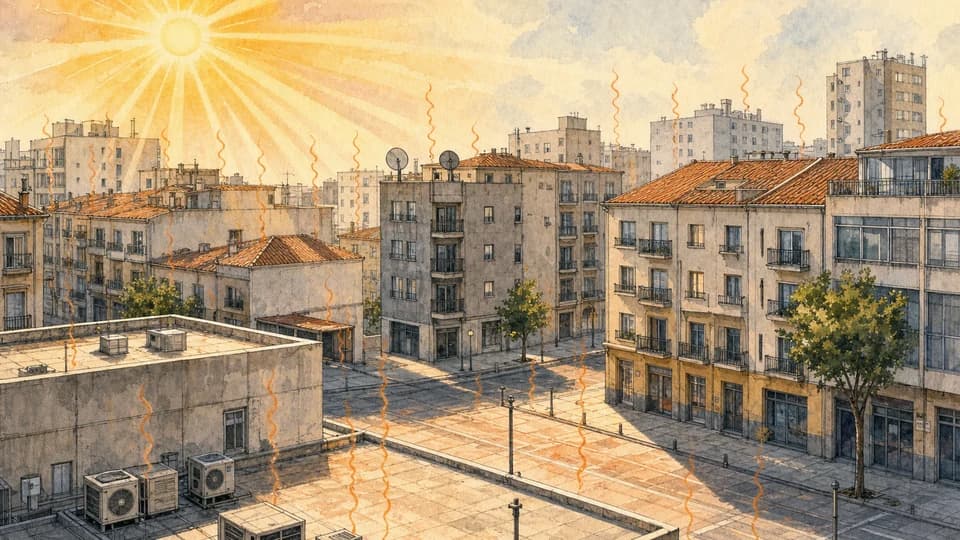
1Dark roofs, asphalt, and exposed pavements absorb solar energy. By afternoon, they can become much hotter than shaded soil or vegetation.
Urban heat island - Nicosia
863 mapped cells scoring urban heat risk, exposure, vulnerability, and heat-island potential across Nicosia.
UHI potential (UHIp) from a physics-constrained model trained on temperature measurements. Shows where the built form is more likely to store and release heat.
Filter the heat cells to a WUDAPT local climate zone group.
Search an address or choose a point on the map
Risk, exposure, vulnerability, and UHIE potential: Nicosia study dataset. Local climate zones: WUDAPT global LCZ map.
Tap any cell to see how much heat it holds and who lives there.
Very Low relative UHIE potential in the supplied dataset.
Low relative UHIE potential in the supplied dataset.
Moderate relative UHIE potential in the supplied dataset.
High relative UHIE potential in the supplied dataset.
Very High relative UHIE potential in the supplied dataset.
The urban heat island effect happens when built-up parts of Nicosia become warmer than nearby rural or greener areas. Roads, roofs, and dense buildings absorb solar heat all day and release it slowly after dark, so some streets simply never get the chance to cool down.
Dark roofs, asphalt, and exposed pavements absorb solar energy. By afternoon, they can become much hotter than shaded soil or vegetation.
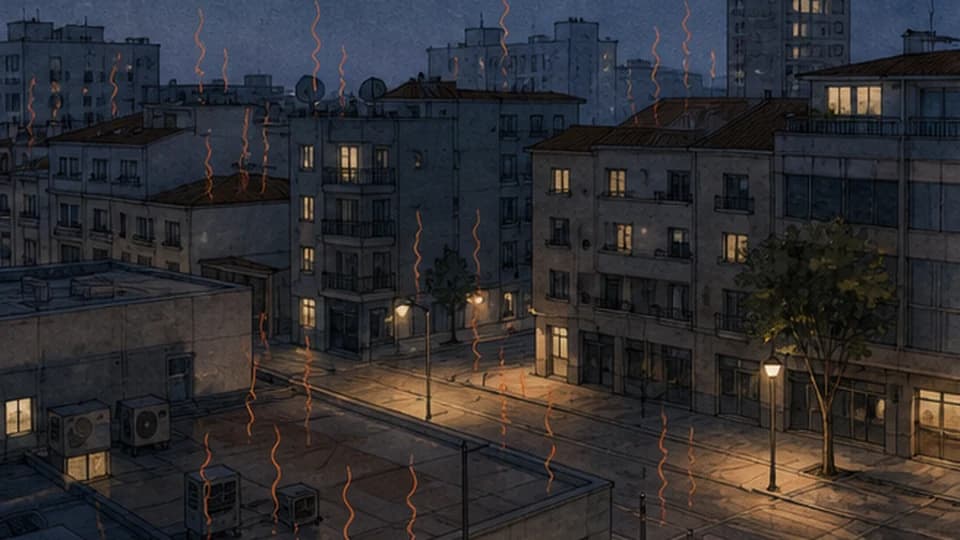
Close buildings and narrow streets hold warm air. At night, stored heat is released back into the street, so the city cools more slowly.
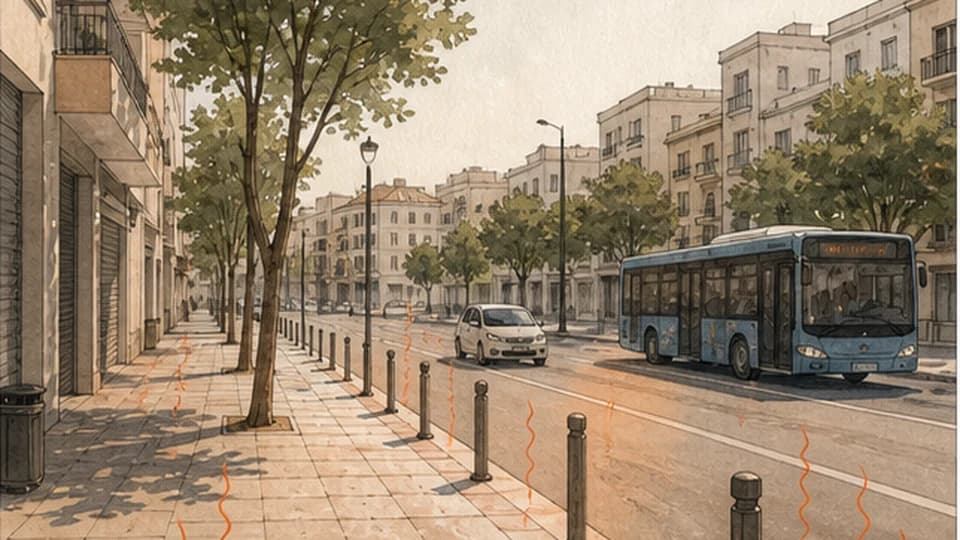
Higher outdoor temperatures affect walking, work, transport, schools, and older residents. The same temperature can be more dangerous in exposed streets.
The Nicosia layer is built from the study's UHI risk dataset. The city is divided into 863 cells of 200 × 200 metres each, roughly the scale of an urban block. Every cell carries four standardized indicators: combined risk, heat-island potential (hazard), population exposure, and demographic vulnerability.
What the three components measure, and how they combine into risk. Methodology basis: the supplied Nicosia UHI risk dataset and its accompanying modelling study.
Risk is calculated as Hazard × Exposure × Vulnerability. Because the three factors are multiplied, a low value in any single component significantly reduces overall risk. High UHI risk only emerges where strong heat potential coincides with both high population presence and high demographic susceptibility.
The UHI potential (UHIp), derived from a physics-constrained model trained on car-mounted temperature measurements. It represents how much each cell can raise local temperature due to its built form, averaged for the August-September peak heat window.
Total population living inside each 200 × 200 m cell. Before being used in the risk calculation, population values are adjusted using a logarithmic scale so that areas with very large populations do not disproportionately influence the results. Cells with no population have an exposure value of zero.
The share of vulnerable people in each cell, calculated as (pregnant women + infants + elderly) divided by total population. This produces a ratio between 0 and 1 that highlights cells where a greater proportion of residents may be more susceptible to heat-related impacts.
All hazard and exposure layers are standardized to a 0-1 range using min-max normalization. On the platform, this is displayed as a 0-10 scale for readability. A score is not an absolute measurement. It marks how a cell compares to others in the study area. A cell scoring 8.1 / 10 on exposure means it is near the top of the population range across all 863 cells, not that a specific number of people are at risk.
When the map shows 'Vulnerable population: 41', that means an estimated 41 pregnant women, infants, and elderly persons live inside that single 200 × 200 m cell. 'Vulnerable share: 16%' means they make up 16% of the cell's total population.
Evidence-based strategies for reducing urban heat, street by street.
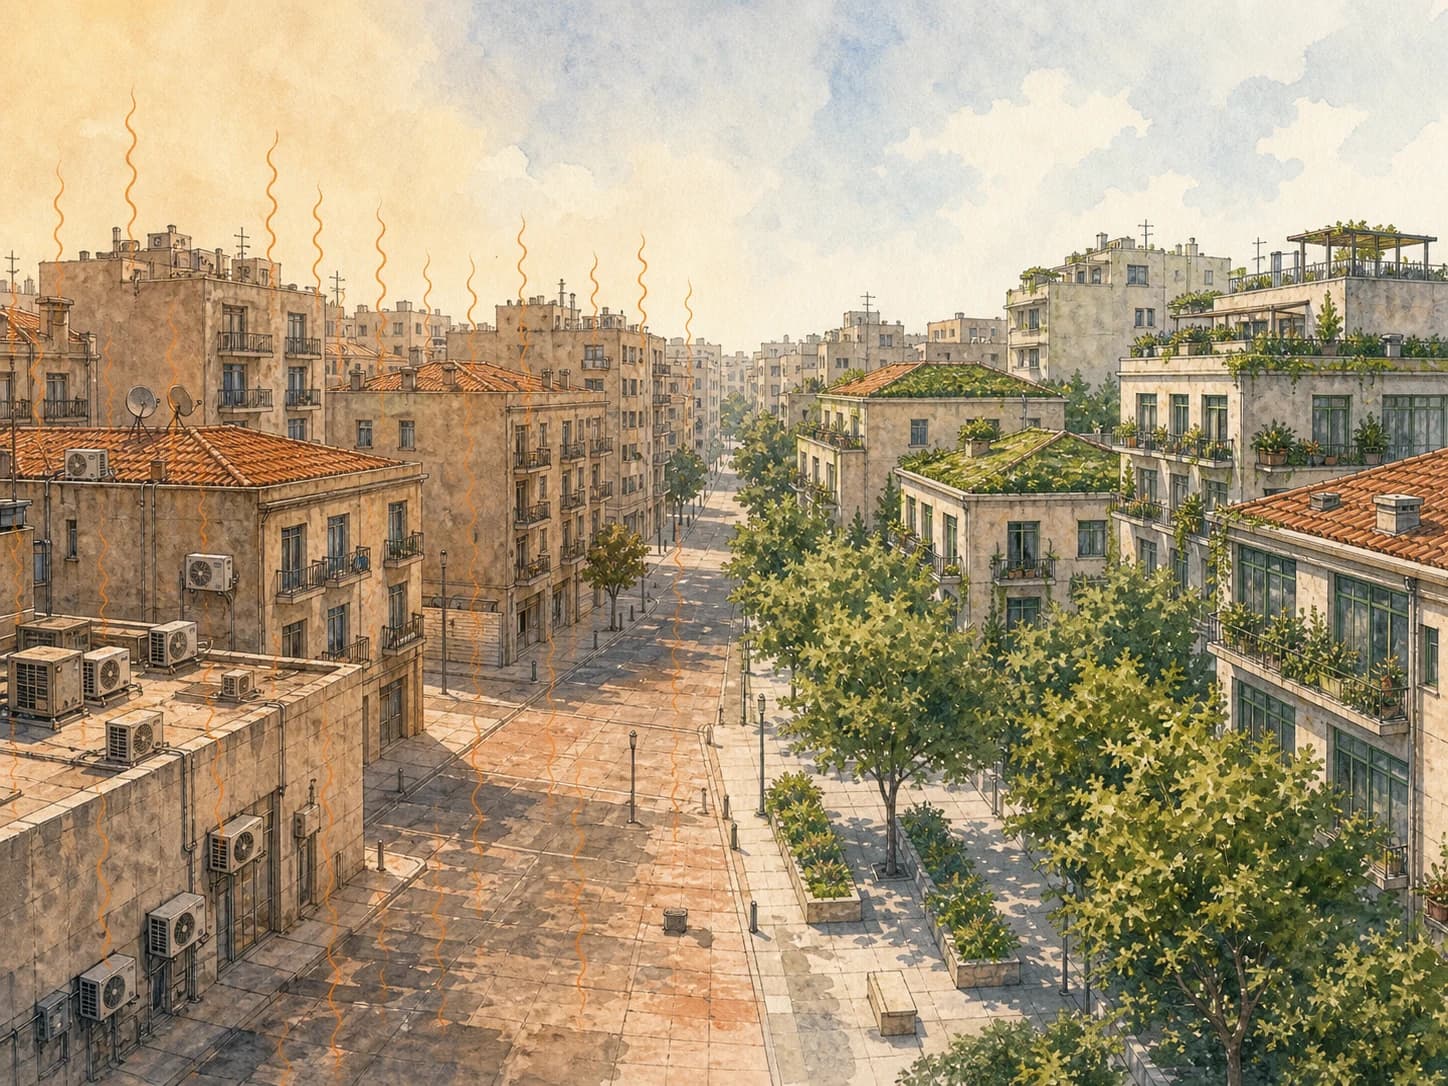
The same neighbourhood, with and without green infrastructure
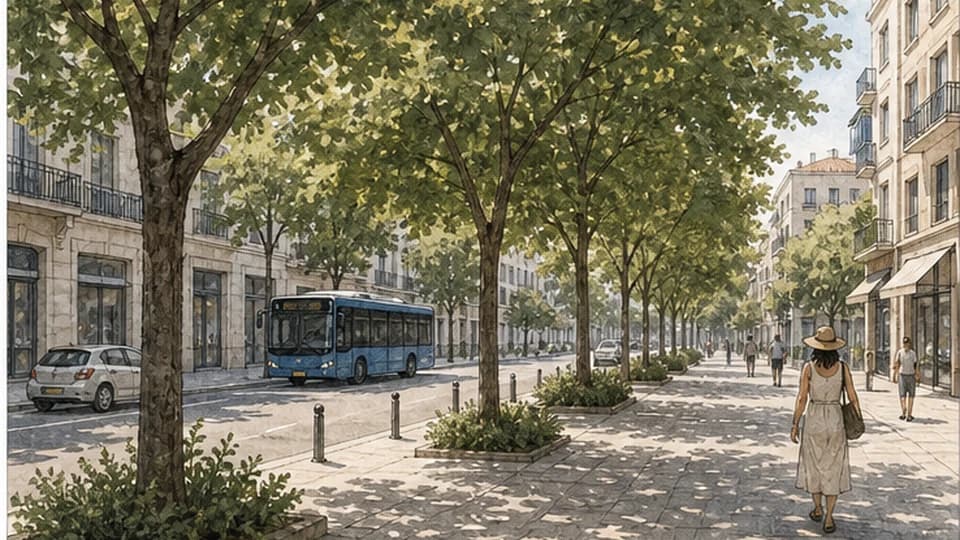
Continuous street-tree planting can shade walking routes and reduce pedestrian heat exposure. Canopy design, spacing, and local street conditions determine how much cooling people experience.
Urban Forestry & Urban Greening · 2023
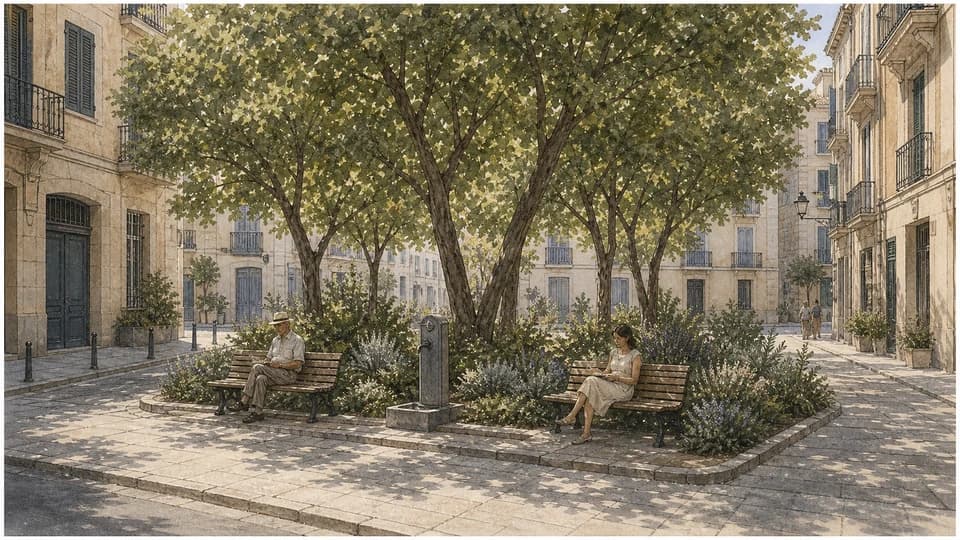
Small planted spaces can provide local cooling where larger parks are not possible. Research shows that canopy coverage and vertical tree structure strongly influence their thermal comfort benefits.
Landscape and Urban Planning · 2025
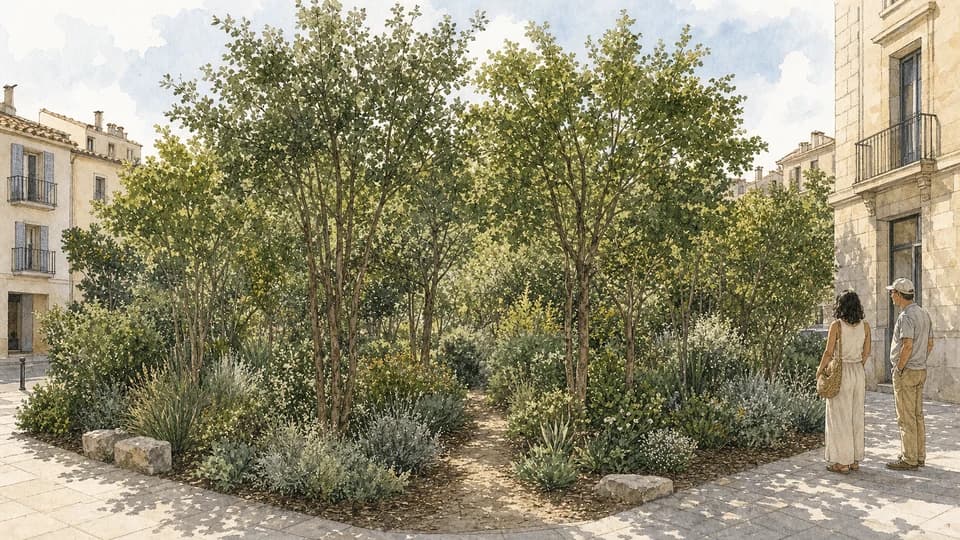
Tiny forests use dense, layered planting on compact urban sites. Site conditions, soil, suitable species, and community participation should guide their design and long-term care.
Urban Ecosystems · 2023
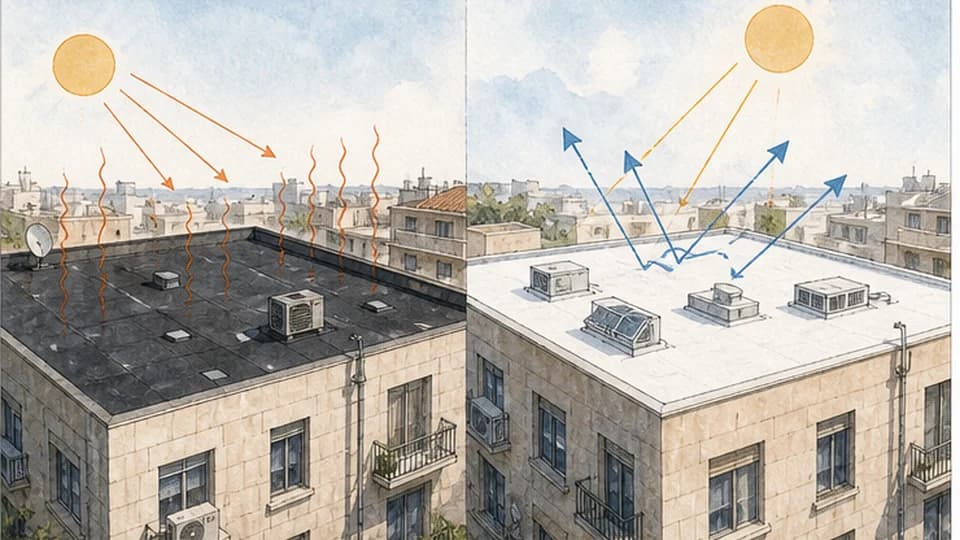
Public buildings can use planted or light-colored roofs to reduce absorbed heat, support biodiversity, and create useful green space where ground-level space is limited.
Cyprus University of Technology
The climate risk assessment and the resulting maps presented on this website were produced using the CLIMAAX methodological framework through the CLIMAAX-NIC project. The project is implemented by the Nicosia Municipality in collaboration with the CYENS Centre of Excellence and is funded by the European Union under the Horizon Europe programme.